5 Methylation Analysis
The CGmapTools supports both differentially methylated site (DMS) analyses and differentially methylated region (DMR) analyses are supported.
As the current available DNA methylome are either low coverage (such as WGBS) or fragmented in covered region (such as RRBS). In CGmapTools, we proposed a novel method dynamic fragmentation strategy for identifying DMRs between a pair of CGmap files.
5.1 dms
Differentially methylated site analysis, supporting Chi-square and Fisher tests.
- Command
cgmaptools dms -h# Usage: cgmaptools dms [-i <CGmapInter>] [-m 5 -M 100] [-o output]
# (aka CGmapInterDiffSite)
# Description:
# Get the differentially methylated sites for two samples.
# Contact: Guo, Weilong; guoweilong@126.com
# Last Update: 2017-01-20
# Input Format, same as the output of CGmapIntersect.py:
# Chr1 C 3541 CG CG 0.8 4 5 0.4 4 10
# Output Format:
# chr1 C 4654 CG CG 0.92 1.00 8.40e-01
# chr1 C 4658 CHH CC 0.50 0.00 3.68e-04
# chr1 G 8376 CG CG 0.62 0.64 9.35e-01
#
# Options:
# -h, --help show this help message and exit
# -i FILE File name for CGmapInter, STDIN if omitted
# -m INT, --min=INT min coverage [default : 0]
# -M INT, --max=INT max coverage [default : 100]
# -o OUTFILE To standard output if omitted. Compressed output if
# end with .gz
# -t STRING, --test-method=STRING
# chisq, fisher [default : chisq]Example
cgmaptools dms -i intersect_CG.gz -m 4 -M 100 -o DMS.gz -t fisherOutput format
- Example
chr1 C 4654 CG CG 0.92 1.00 8.40e-01 chr1 C 4658 CHH CC 0.50 0.00 3.68e-04 chr1 G 8376 CG CG 0.62 0.64 9.35e-01- Column Description

Figure 5.1: Output format description for cgmaptools dms
5.2 dmr
Differentially methylated region analysis, using dynamic fragmentation strategy .
- Command
cgmaptools dmr -h# Usage: cgmaptools dmr [-i <CGmapInter>] [-m 5 -M 100] [-o output]
# (aka CGmapInterDiffReg)
# Description:
# Get the differentially methylated regions using dynamic fragment strategy.
# Author: Guo, Weilong; guoweilong@126.com;
# Last Updated: 2018-01-02
# Input Format, same as the output of CGmapIntersect.py:
# chr1 C 3541 CG CG 0.8 4 5 0.4 4 10
# Output Format, Ex:
# #chr start end t pv mC_A mC_B N_site
# chr1 1004572 1004574 inf 0.00e+00 0.1100 0.0000 20
# chr1 1009552 1009566 -0.2774 8.08e-01 0.0200 0.0300 15
# chr1 1063405 1063498 0.1435 8.93e-01 0.6333 0.5733 5
#
#
# Options:
# -h, --help show this help message and exit
# -i FILE File name for CGmapInter, STDIN if omitted
# -c INT, --minCov=INT min coverage [default : 4]
# -C INT, --maxCov=INT max coverage [default : 500]
# -s INT, --minStep=INT
# min step in bp [default : 100]
# -S INT, --maxStep=INT
# max step in bp [default : 1000]
# -n INT, --minNSite=INT
# min N sites [default : 5]
# -o OUTFILE To standard output if omitted. Compressed output if
# end with .gzExample
cgmaptools dmr -i intersect_CG.gz -o DMR.gzOutput format
- Example
chr1 1004572 1004574 inf 0.00e+00 0.1100 0.0000 chr1 1009552 1009566 -0.2774 8.08e-01 0.0200 0.0300 chr1 1063405 1063498 0.1435 8.93e-01 0.6333 0.5733 chr1 1082130 1082133 -0.0822 9.42e-01 0.5000 0.5550 chr1 1123931 1123933 inf 0.00e+00 0.0600 0.0000- Column Description

Figure 5.2: Output format description for cgmaptools dmr
- Dynamic Fragment Strategy
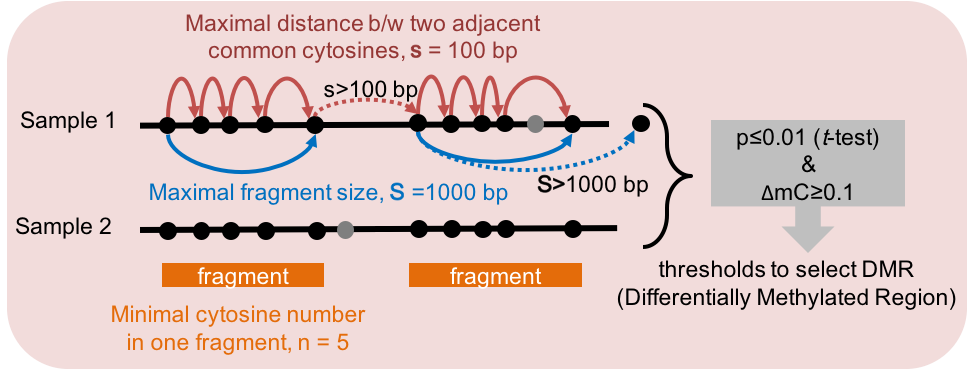
Figure 5.3: Dynamic Fragmentation Strategy
5.3 asm
Feeding with the precisely predicted heterozygous SNVs (by cgmaptools snv), CGmapTools can identify Allele-Specific Methylated (ASM) regions from BAM files.
Following showed an interesting ASM region by analysing a previous cohort (Weilong Guo, et al., Scientifc Report, 2016).
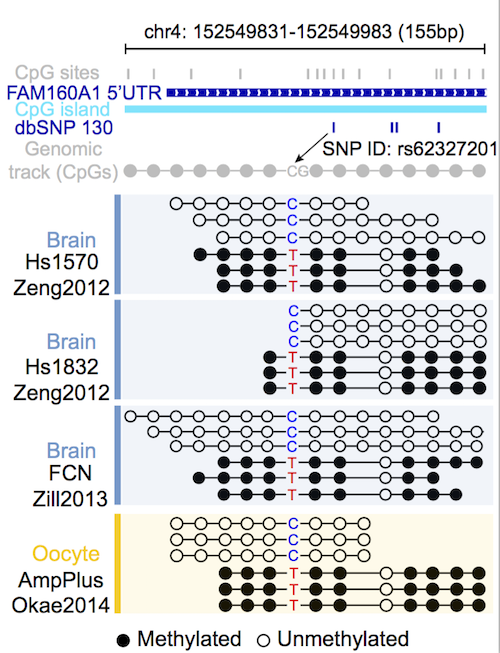
Figure 5.4: Examples showed allele-specific methylated region reported by CGmapTools
- Command
cgmaptools asm -h# DESCRIPTION
# Allele specific methylated region/site calling
# * Fisher exact test for site calling.
# * Students' t-test for region calling.
#
# USAGE
# cgmaptools asm [options] -r <ref.fa> -b <input.bam> -l <snp.vcf>
# (aka ASM)
#
# Options:
# -r Samtools indexed reference genome seqeunce, fasta format. eg. hg19.fa
# - use samtools to index reference first: samtools faidx hg19.fa
# -b Samtools indexed Bam format file.
# - use samtools to index bam file first: samtools index <input.bam>
# -l SNPs in vcf file format.
# -s Path to samtools eg. /home/user/bin/samtools
# - by defualt, we try to search samtools in your system PATH,
# -o Output results to file. [default: STDOUT]
# -t C context. [default: CG]
# - available context: C, CG, CH, CW, CC, CA, CT, CHG, CHH
# -m Specify calling mode. [default: asr]
# - alternative: ass
# - asr: allele specific methylated region
# - ass: allele specific methylated site
# -d Minimum number of read for each allele linked site to call ass. [default: 3]
# - ass specific.
# -n Minimum number of C site each allele linked to call asr. [default: 2]
# - asr specific.
# -D Minimum read depth for C site to call methylation level when calling asr. [default: 1]
# - asr specific.
# -L Low methylation level threshold. [default: 0.2]
# - allele linked region [or site] with low methylation level should be no greater than this threshold.
# -H High methylation level threshold. [default: 0.8]
# - allele linked region[or site] with high methylation level should be no less than this threshold.
# -q Adjusted p value using Benjamini & Hochberg (1995) ("BH" or its alias "fdr"). [default: 0.05]
# -h Help message.
#
# AUTHOR
# Contact: Zhu, Ping; pingzhu.work@gmail.com
# Last update: 2016-12-07Example
gawk '{if(/^#/){print}else{print "chr"$0;}}' bayes.vcf > bayes2.vcfcgmaptools asm -r genome.fa -b WG.bam -l bayes2.vcf > WG.asmOutput format for ASS (Allele-Specific methylated Site)
- Example
Chr SNP_Pos Ref Allele1 Allele2 C_Pos Allele1_linked_C Allele2_linked_C Allele1_linked_C_met Allele2_linked_C_met pvalue fdr ASM Chr1 8949221 T T A 8949252 30,2 6,0 0.94 1.00 1.00e+00 1.00e+00 FALSE Chr1 8965481 A A T 8965494 12,3 12,4 0.80 0.75 1.00e+00 1.00e+00 FALSE- Column Description

Figure 5.5: Output format description for cgmaptools asm -m ass
Output format for ASR (Allele-Specific methylated Region)
- Example
Chr Pos Ref Allele1 Allele2 Allele1_linked_C Allele2_linked_C Allele1_linked_C_met Allele2_linked_C_met pvalue fdr ASM chr1 8943402 A A T 1-1 0.8-1 1 0.9 5.01e-01 7.52e-01 FALSE chr1 8966879 C C G 0.93-0-0 0.81-0-0 0.31 0.27 9.27e-01 9.53e-01 FALSE- Column Description

Figure 5.6: Output format description for cgmaptools asm -m asr
5.4 mbed
The cgmaptools mbed command will calculated one DNA methylation level for all the investiaged regions, which is different from cgmaptools mtr.
For example, this function can be applied when calculating the average DNA methylation levels in regions, such as promoter, gene body, specific Transposon Elements (TEs).
- Command
cgmaptools mbed -h# Usage: cgmaptools mbed [-i <CGmap>] -b <regin.bed> [-c 5 -C 500 -s]
# (aka CGmapMethylInBed)
# Description: Calculated bulk average methylation levels in given regions.
# Contact: Guo, Weilong; guoweilong@126.com
# Last Update: 2017-01-20
# Options:
# -i String, CGmap file; use STDIN if not specified
# Please use "gunzip -c <input>.gz " and pipe as input for gzipped file.
# Ex: chr1 G 3000851 CHH CC 0.1 1 10
# -b String, BED file, should have at least 4 columns
# Ex: chr1 3000000 3005000 -
# -c Int, minimum Coverage [Default: 5]
# -C Int, maximum Coverage [Default: 500]
# -s Strands would be distinguished when specified
# -h help
#
# Output to STDOUT:
# Title Count mean_mC
# sense 34 0.2353
# antisense 54 0.2778
# total 88 0.2614
# Notice:
# The overlapping of regions would not be checked.
# A site might be considered multiple times.Example
zcat WG.CGmap.gz | cgmaptools mbed -b region.bedOutput format
- Example
chr   sense_Count   sense_mC    anti_Count  anti_mC all_Count   all_mC
chr1    203   0.08127     178     0.1148      381     0.09692
chr2    185   0.07045     257     0.05586     442     0.06197
chr3    313   0.1042      250     0.1358      563     0.1182
chr4    300   0.1218      271     0.13      571   0.1257
chr5    282   0.1272      222     0.1589      504     0.1412
5.5 mbin
This function will calculated the average methylation levels in equal-length bins, across genome, generating both summary table and distribution graph.
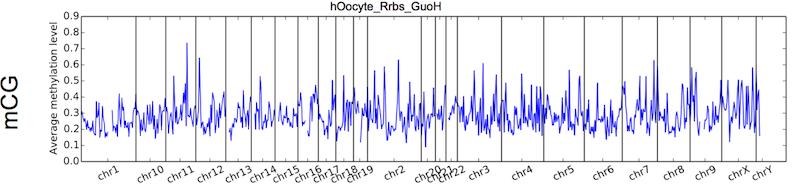
Figure 5.7: Output figure example for cgmaptools mbin
- Command
cgmaptools mbin -h# Usage: cgmaptools mbin [-i <CGmap>] [-c 10 --CXY 5 -B 5000000]
# (aka CGmapMethInBins)
# Description: Generate the methylation in Bins.
# Contact: Guo, Weilong; guoweilong@126.com
# Last Update: 2016-10-26
# Output Ex:
# chr1 1 5000 0.0000
# chr1 5001 10000 0.0396
# chr2 1 5000 0.0755
# chr2 5001 10000 0.0027
# chr3 1 5000 na
#
# Options:
# -h, --help show this help message and exit
# -i FILE File name end with .CGmap or .CGmap.gz. If not
# specified, STDIN will be used.
# -B BIN_SIZE Define the size of bins [Default: 5000000]
# -c COVERAGE The minimum coverage for site selection [Default: 10]
# -C CONTEXT, --context=CONTEXT
# specific context: CG, CH, CHG, CHH, CA, CC, CT, CW
# use all sites if not specified
# --cXY=COVERAGEXY Coverage for chrX/Y should be half that of autosome
# for male [Default: same with -c]
# -f FIGTYPE, --figure-type=FIGTYPE
# png, pdf, eps. Will not generate figure if not
# specified
# -H FLOAT Height of figure in inch [Default: 4]
# -W FLOAT Width of figure in inch [Default: 8]
# -p STRING Prefix for output figures
# -t STRING, --title=STRING
# title in the output figures- Example
cgmaptools mbin -i WG.CGmap.gz -B 500 -c 4 -f png -t WG -p WG > mbin.WG.data
File format
The output format:
chr1    1       5000    0.0000
chr1    5001    10000   0.0396
chr2    1       5000    0.0755
chr2    5001    10000   0.0027
chr3    1       5000    na
5.6 mmbin
This function will calculate the average methylation levels in equal-length bins for mulitple samples, generating a summary table.
- Command
cgmaptools mmbin -h# Usage: cgmaptools mmbin [-l <1.CGmap[,2.CGmap,..]>] [-c 10 --CXY 5 -B 5000000]
# (aka CGmapsMethInBins)
# Description: Generate the methylation in Bins.
# Contact: Guo, Weilong; guoweilong@126.com
# Last Update: 2018-05-02
# Output Ex:
# chr1 1 5000 0.0000
# chr1 5001 10000 0.0396
# chr2 1 5000 0.0755
# chr2 5001 10000 0.0027
# chr3 1 5000 na
#
# Options:
# -h, --help show this help message and exit
# -l FILE File name list, end with .CGmap or .CGmap.gz. If not
# specified, STDIN will be used.
# -t FILE List of samples
# -B BIN_SIZE Define the size of bins [Default: 5000000]
# -C CONTEXT, --context=CONTEXT
# specific context: CG, CH, CHG, CHH, CA, CC, CT, CW
# use all sites if not specified
# -c COVERAGE The minimum coverage for site selection [Default: 10]
# --cXY=COVERAGEXY Coverage for chrX/Y should be half that of autosome
# for male [Default: same with -c]Example
cgmaptools mmbin -l WG.CGmap.gz,RR.CGmap.gz,RR2.CGmap.gz,merge.CGmap.gz -c 4 -B 2000 | gawk '{printf("%s:%s-%s", $1, $2, $3); for(i=4;i<=NF;i++){printf("\t%s", $i);} printf("\n");}' > mmbin```
Output format
- Example
chr pos1 pos2 tag1 tag2 tag3 Chr1 111403 113403 0.05 nan 0.02 Chr1 111500 112500 1.00 0.80 0.60 Chr2 20000 20500 0.96 0.33 0.66- Column Description

Figure 5.8: Output format description for cgmaptools mmbin
5.7 mfg
The cgmaptools mfg supports studys of Methylation in FraGmented regions. The function can be applied to draw mC distribution across gene body, transposon elements, and other user-provided regions. The fragmented regions can be generated using cgmaptools bed2fragreg.
- Command
cgmaptools mfg -h# Usage: cgmaptools mfg [-i <CGmap>] -r <region> [-c 5 -C 500]
# Description: Calculated methylation profile across fragmented regions.
# Contact: Guo, Weilong; guoweilong@126.com
# Last Update: 2017-01-20
# Options:
# -i String, CGmap file; use STDIN if not specified
# Please use "gunzip -c <input>.gz " and pipe as input for gzipped file.
# chr1 G 851 CHH CC 0.1 1 10
# -r String, Region file, at least 4 columns
# Format: chr strand pos_1 pos_2 pos_3 ...
# Regions would be considered as [pos_1, pos_2), [pos_2, pos_3)
# Strand information will be used for distinguish sense/antisense strand
# Ex:
# #chr strand U1 R1 R2 D1 End
# chr1 + 600 700 800 900 950
# chr1 - 1600 1500 1400 1300 1250
# -c Int, minimum Coverage [Default: 5]
# -C Int, maximum Coverage [Default: 500]
# Sites exceed the coverage range will be discarded
# -x String, context [use all sites by default]
# string can be CG, CH, CHG, CHH, CA, CC, CT, CW
# -h help
# Output to STDOUT:
# Region_ID U1 R1 R2 D1
# sense_ave_mC 0.50 0.40 0.30 0.20
# sense_sum_mC 5.0 4.0 3.0 2.0
# sense_sum_NO 10 10 10 10
# anti_ave_mC 0.40 0.20 0.10 NaN
# anti_sum_mC 8.0 4.0 2.0 0.0
# anti_sum_NO 20 20 20 0
# total_ave_mC 0.43 0.27 0.17 0.2
# total_sum_mC 13.0 8.0 5.0 2.0
# total_sum_NO 30 30 30 10Example
for CHR in 1 2 3 4 5; do for P in 1 2 3 4 5; do echo | gawk -vC=$CHR -vP=$P -vOFS="\t" '{print "chr"C, P*1000, P*1000+1000, "+";}' done done | cgmaptools bed2fragreg \ -n 30 -F 50,50,50,50,50,50,50,50,50,50 -T 50,50,50,50,50,50,50,50,50,50 > fragreg.bedgunzip -c WG.CGmap.gz | cgmaptools mfg -r fragreg.bed -c 2 -x CG > WG.mfgOutput format
- Example
Region_ID       R_1     R_2     R_3     R_4
sense_ave_mC    0.50    0.40    0.30    0.20
sense_sum_mC    5.0     4.0     3.0     2.0
sense_sum_NO    10      10      10      10
anti_ave_mC     0.40    0.20    0.10    NaN
anti_sum_mC     8.0     4.0     2.0     0.0
anti_sum_NO     20      20      20      0
total_ave_mC    0.43    0.27    0.17    0.2
total_sum_mC    13.0    8.0     5.0     2.0
total_sum_NO    30      30      30      10
Column Description
- Tab-delimited file with header line
- Content in 1st col is fixed
- Column number is dynamic
- Invalid number is annotated as “NaN”
5.8 mstat
CGmapTools provide resourceful statistic analysis on DNA methylation globally. The cgmaptools mstat command will generated a table summary, together with several graphs:
- mC contributions of different contexts in Pie chart
- Bulk mC levels of different contexts
- Fragmented distribution of mC in different contexts
The methylation contexts are diffferent for plants and animals. - For plants, the contexts for DNA methylations are known as CG, CHG and CHH, where \(H=\{A,C,T\}\). - For animals, the situation is different. In 2014, Weilong Guo, et al. showed that it is unnecessary to seperate CHG methylations and CHH methylations in human. In 2016, Weilong Guo, et al. designed MiDD method and de novo predicted the main separated contexts for non-CG (CH) methylation should be CW (\(W=\{A,T\}\)) and CC, and mCW is cell-type specific and conserved between human and mice. In CGmapTools, we support both human view (CG, CW and CC) and plant view (CG, CHG, and CHH) for DNA methylation contexts.
- Command
cgmaptools mstat -h# Usage: cgmaptools mstat [-i <CGmap>]
# (aka CGmapStatMeth)
# Description: Generate the bulk methylation.
# Contact: Guo, Weilong; guoweilong@126.com
# Last Update: 2018-05-02
# Output Ex:
# MethStat context C CG CHG CHH CA CC CT CH CW
# mean_mC global 0.0798 0.3719 0.0465 0.0403 0.0891 0.0071 0.0241 0.0419 0.0559
# sd_mCbyChr global 0.0078 0.0341 0.0163 0.0110 0.0252 0.0049 0.0076 0.0096 0.0148
# count_C global 10000 1147 2332 6521 3090 2539 3224 8853 6314
# contrib_mC global 1.0000 0.5348 0.1360 0.3292 0.3452 0.0228 0.0973 0.4652 0.4424
# quant_mC [0] 8266 471 2012 5783 2422 2421 2952 7795 5374
# quant_mC (0.00 ,0.20] 705 182 155 368 272 97 154 523 426
# mean_mC_byChr chr1 0.0840 0.4181 0.0340 0.0412 0.0794 0.0065 0.0251 0.0393 0.0513
# mean_mC_byChr chr10 0.0917 0.4106 0.0758 0.0421 0.0968 0.0097 0.0349 0.0502 0.0655
#
# Options:
# -h, --help show this help message and exit
# -i FILE File name end with .CGmap or .CGmap.gz. If not
# specified, STDIN will be used.
# -c COVERAGE The minimum coverage for site selection [Default: 10]
# -f FILE, --figure-type=FILE
# png, pdf, eps. Will not generate figure if not
# specified
# -H FLOAT Height of figure in inch [Default: 3]
# -W FLOAT Width of figure in inch [Default: 8]
# -p STRING Prefix for output figures
# -t STRING, --title=STRING
# title in the output figuresExample
cgmaptools mstat -i WG.CGmap.gz -c 4 -f png -p WG -t WG > WG.mstat.dataFile format
The output format:
MethStat        context C       CG      CHG     CHH     CA      CC      CT      CH      CW
mean_mC         global  0.0798  0.3719  0.0465  0.0403  0.0891  0.0071  0.0241  0.0419  0.0559
sd_mCbyChr      global  0.0078  0.0341  0.0163  0.0110  0.0252  0.0049  0.0076  0.0096  0.0148
count_C         global  10000   1147    2332    6521    3090    2539    3224    8853    6314
contrib_mC      global  1.0000  0.5348  0.1360  0.3292  0.3452  0.0228  0.0973  0.4652  0.4424
quant_mC        [0]     8266    471     2012    5783    2422    2421    2952    7795    5374
quant_mC   (0.00 ,0.20] 705     182     155     368     272     97      154     523     426
mean_mC_byChr   chr1    0.0840  0.4181  0.0340  0.0412  0.0794  0.0065  0.0251  0.0393  0.0513
mean_mC_byChr   chr10   0.0917  0.4106  0.0758  0.0421  0.0968  0.0097  0.0349  0.0502  0.0655
Output figures
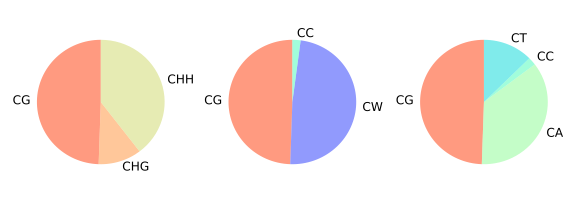
Figure 5.9: mC contribution example
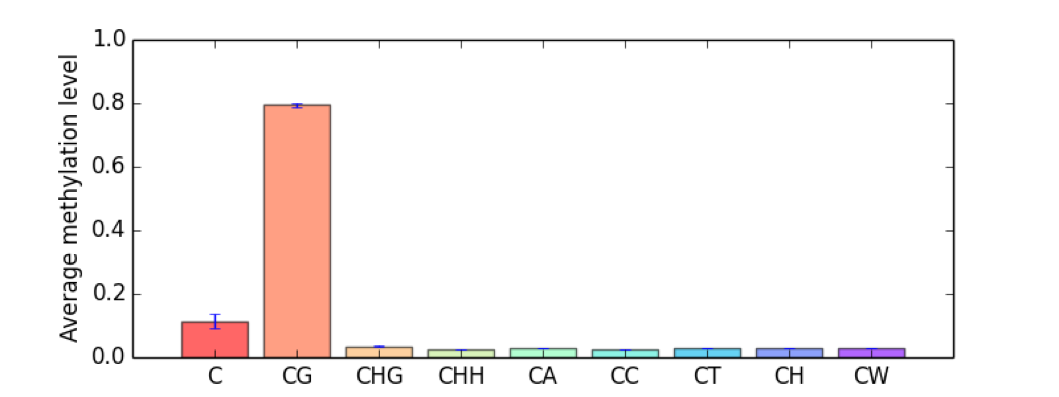
Figure 5.10: Bulk mC example
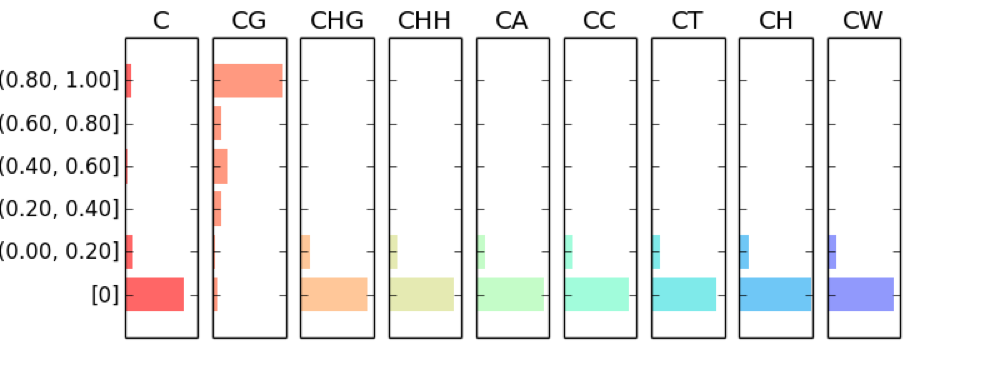
Figure 5.11: mC fragmented distribution example
5.9 mtr
The cgmaptools mtr command will calculated the DNA methylation levels for each investiaged region.
- Command
cgmaptools mtr -h# Usage: cgmaptools mtr [-i <CGmap>] -r <region> [-o <output>]
# (aka CGmapToRegion)
# Description: Calculated the methylation levels in regions in two ways.
# Contact: Guo, Weilong; guoweilong@126.com
# Last Update: 2018-07-05
# Format of Region file:
# #chr start_pos end_pos
# chr1 8275 8429
# Output file format:
# #chr start_pos end_pos mean(mC) #_C #read(C)/#read(T+C) #read(T+C)
# chr1 8275 8429 0.34 72 0.40 164
# Note: The two input CGmap files should be sorted by Sort_chr_pos.py first.
# This script would not distinguish CG/CHG/CHH contexts.
#
# Options:
# -h, --help show this help message and exit
# -i FILE File name end with .CGmap or .CGmap.gz. If not specified, STDIN
# will be used.
# -r FILE Filename for region file, support *.gz
# -o OUTFILE To standard output if not specified.Example
cgmaptools mtr -i WG.CGmap.gz -r region.bed -o WG.mtr.gzInput region format
#chr    start_pos  end_pos
chr1    8275       8429
Output format
- Example
chr1 8275 8429 0.34 72 0.40 164 chr1 8899 8999 0.20 40 0.33 198 chr2 8275 8429 0.50 12 0.45 40- Column Description

Figure 5.12: Output format description for cgmaptools mtr