7 Graphics
7.1 lollipop
The consideration that we design novel Lollipop plot, is to be able to distinguish un-methylated sites and un-detected sites. Each covered cytosine would have a large round head; color and height of the bar represent DNA methylation level.
- Command
cgmaptools lollipop -h# Usage: cgmaptools lollipop [options] file
# (aka mCLollipop)
# Description: Plot local mC level for multiple samples
# Contact: Guo, Weilong; guoweilong@126.com
# Last Update: 2018-04-10
# Example:
# mCLollipop [-i input] -o gene.png
# -Input Format (-i)
# Can be output by "cgmaptools mergelist tomatrix". Use STDIN if omitted.
# The 1st line (header line) is required.
# Example:
# chr pos tag1 tag2 tag3
# Chr1 111403 0.30 nan 0.80
# Chr1 111406 0.66 0.40 0.60
# -Site File (-s)
# >= 3 columns, the 1st line (header line) is required, using R color name or "NaN".
# To show specific sites (such as DMS, SNV) at the bottom as triangles.
# Example:
# chr pos A_vs_B B_vs_C A_vs_C
# chr1 13116801 NaN NaN darkgreen
# chr1 13116899 NaN red NaN
# -Region File (-b)
# the first 4 columns are required.
# To show specific region (such as DMR, Repeats) at the bottom as blocks.
# Example:
# chr1 213941196 213942363 hyper-DMR
# chr1 213942363 213943530 hypo-DMR
# # chr left right region-description
# -annotation file (-a), refFlat Format:
# To show the structure of genes/transcripts. One-line in annotation, one-track in figure.
# Example:
# GeneA TransA chr2 + 1000 2000 1100 1950 3 1100,1500,1700, 1200,1580,1950,
# # GeneID TrandID ChrID Strand TransLeft TransRight CDSLeft CDSRight nExon ExonLefts ExonRights
#
#
# Options:
# -i INFILE, --infile=INFILE
# input file, use STDIN if ommited, multiple-chr is not suggested
#
# -a ANNOTATION, --annotation=ANNOTATION
# [opt] annotation file name, refFlat format
#
# -o OUTFILE, --outfile=OUTFILE
# [opt] output file
#
# -f FORMAT, --format=FORMAT
# [opt] the format for output figure: pdf (default), png, eps
#
# -l LEFT, --left=LEFT
# [opt] Left-most position, use the 1st position if omitted
#
# -r RIGHT, --right=RIGHT
# [opt] Right-most position, use the last position of input if omitted
#
# -c CHR, --chr=CHR
# [opt] chromosome name, use the chr in 1st line of input file if omitted
#
# -s SITE, --site=SITE
# [opt] file of site to be marked
#
# -b BED, --bed=BED
# [opt] BED file for region to be markered
#
# -t TITLE, --title=TITLE
# [opt] text shown on title
#
# -w WIDTH, --width=WIDTH
# [opt] width (in inch). Default: 8.
#
# --height=HEIGHT
# [opt] height (in inch). Default: 8.
#
# -h, --help
# Show this help message and exitExample
cgmaptools lollipop -i matrix.CG.gz -a anno.refFlat -f pdfFigure examples
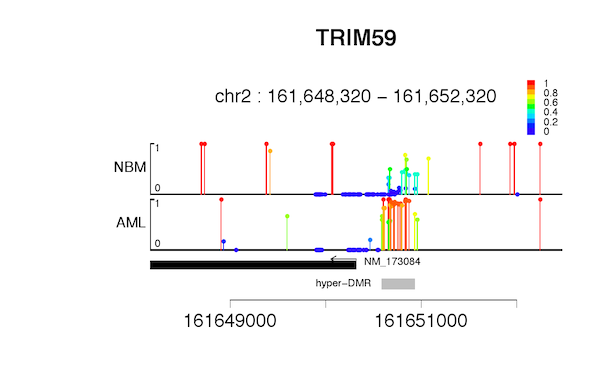
Figure 7.1: Lollipop example-1
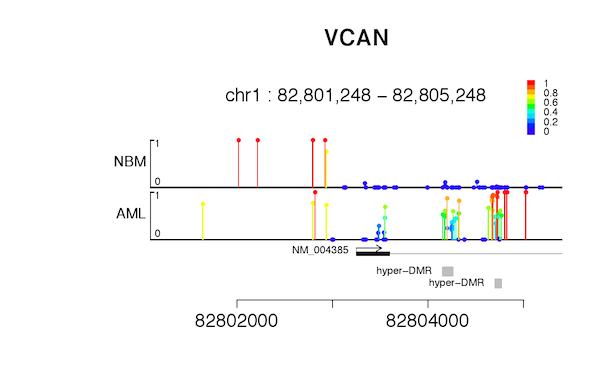
Figure 7.2: Lollipop example-2
refFlat format
Example
GeneA TransA chr2 + 1000 2000 1100 1950 3 1100,1500,1700, 1200,1580,1950,
- Description
Col 1: Gene ID
Col 2: Transcript ID
Col 3: chromatine ID
Col 4: strand, “+” or “-”
Col 5: The left-most position of transcript
Col 6: The right-most position of transcript
Col 7: The left-most position of CDS
Col 8: The right-most position of CDS
Col 9: Number of exons
Col 10: List of left-most position of exons, seperated by “,”
Col 11: List of right-most position of exons, seperated by “,”
- Convert GTF format to refFlat format
The following is an example for Z. mays.
“gtfToGenePred” is a command tool downloaded from UCSC utility.
```
gtfToGenePred  -genePredExt -geneNameAsName2 -allErrors  AGPv4.gtf AGPv4.GenePred

paste <(cut -f13 AGPv4.GenePred) <(cut -f1-10 AGPv4.GenePred) > AGPv4.refFlat

paste <(cut -f13 AGPv4.GenePred) <(cut -f1-10 AGPv4.GenePred) | sed -i s/transcript://g | cut -f9 | gawk -F"[\":]" '{print $3"\t"$6;}' | sort -u > trans_gene_ID

cut -f1-10 AGPv4.GenePred > AGPv4.refFlat.tmp

gawk -F"\t" -vOFS="\t" 'ARGIND==1{GeneID[$1]=$2;} ARGIND==2{printf GeneID[$1]"\t"$0}' trans_gene_ID AGPv4.refFlat.tmp > AGPv4.refFlat

rm ${GN}.refFlat.txt AGPv4.GenePred
```
7.2 heatmap
- Command
cgmaptools heatmap -h# Usage: cgmaptools heatmap [options]
# (aka mCBinHeatmap)
# Description: Plot methylation dynamics of target region for multiple samples [heatmap]
# Contact: Zhu, Ping; pingzhu.work@gmail.com
# Last update: 2017-09-16
# Example:
# mCBinHeatmap.R -i input -m white -o chr1.xxx-xxx.pdf
# -Input File Format:
# 1st line is the header.
# Each column contains methylation measurements of a sample.
# Example:
# Region Sample1 Sample2 ...
# Region1 0.1 0.1 ...
# Region2 0.1 0.1 ...
#
#
# Options:
# -i INFILE, --infile=INFILE
# input file
#
# -o OUTFILE, --outfile=OUTFILE
# [opt] output file name. [default: mCBinHeatmap.SysDate.pdf]
#
# -c, --cluster
# [opt] cluster samples by methylation in regions. [default: FALSE]
#
# -l COLORLOW, --colorLow=COLORLOW
# [opt] color used for the lowest methylation value. [default: cyan3]
#
# -m COLORMID, --colorMid=COLORMID
# [opt] color used for the middle methylation value. [default: null]
#
# -b COLORHIGH, --colorHigh=COLORHIGH
# [opt] color used for the highest methylation value. [default: coral2]
#
# -n COLORNUMBER, --colorNumber=COLORNUMBER
# [opt] desired number of color elements in the panel. [default: 10]
#
# -W WIDTH, --width=WIDTH
# [opt] width of figure (inch). [default: 7]
#
# -H HEIGHT, --height=HEIGHT
# [opt] height of figure (inch). [default: 7]
#
# -f FORMAT, --format=FORMAT
# [opt] format of output figure. Alternative: png. [default: pdf]
#
# -R RESOLUTION, --resolution=RESOLUTION
# [opt] Resolution in ppi. Only available for png format. [default: 300]
#
# -h, --help
# Show this help message and exitExample:
cgmaptools mmbin -l 1.CGmap,2.CGmap,3.CGmap > mmbin.tabcgmaptools heatmap -i mmbin.tab -c -o cluster.pdf -f pdfFigure examples
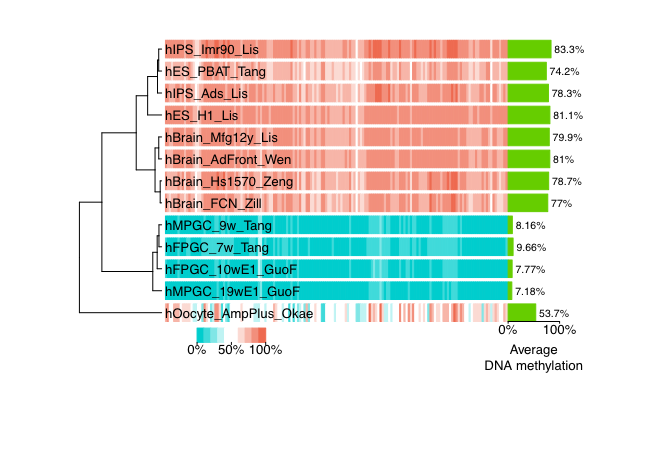
Figure 7.3: heatmap example-1
7.3 fragreg
- Command
cgmaptools fragreg -h# Usage: cgmaptools fragreg [options]
# (aka mCFragRegView)
# Description: Plot methylation dynamics of target and flanking region for multiple samples
# Contact: Zhu, Ping; pingzhu.work@gmail.com
# Last update: 2018-02-12
# Example:
# FragRegView.R -i input -r 5 -o genebody.pdf
# -Input File Format:
# 1st line is the header.
# Each row contains methylation measurements of a sample.
# The user may need to use shell script to generate following format
# based on the results of "cgmaptools mfg".
# Example:
# Sample Up1 Up2 ... Region1 Region2 ... Down1 Down2 ...
# Sample1 0.1 0.1 ... 0.2 0.2 ... 0.3 0.3 ...
# Sample2 0.1 0.1 ... 0.2 0.2 ... 0.3 0.3 ...
#
#
# Options:
# -i INFILE, --infile=INFILE
# input file
#
# -r RATIO, --ratio=RATIO
# [opt] range ratio between target region and flanking region in plot. [default: 5]
#
# -o OUTFILE, --outfile=OUTFILE
# [opt] output file name. [default: FragRegView.SysDate.pdf
#
# -W WIDTH, --width=WIDTH
# [opt] width of figure (inch). [default: 7]
#
# -H HEIGHT, --height=HEIGHT
# [opt] height of figure (inch). [default: 7]
#
# -f FORMAT, --format=FORMAT
# [opt] format of output figure. Alternative: png. [default: pdf]
#
# -R RESOLUTION, --resolution=RESOLUTION
# [opt] Resolution in ppi. Only available for png format. [default: 300]
#
# -h, --help
# Show this help message and exit- Example
The input file can be generated from the output of cgmaptools mfg.
```
cgmaptools mfg -i S1.CGmap.gz -r fragreg.bed -c 2 -x CG > S1.mfg
cgmaptools mfg -i S2.CGmap.gz -r fragreg.bed -c 2 -x CG > S2.mfg
(head -1 S1.mfg | gawk '{$1="Sample"; print $0;}';
 for F in *.mfg; do
   gawk -vSampleName=`echo $F | sed s/.mfg//g` '/total_ave_mC/{$1=SampleName; print $0;}'
 done
) > mfg_merge.xls
cgmaptools fragreg -i mfg_merge.xls -o merge.fragreg.pdf -f pdf
```- Output figure
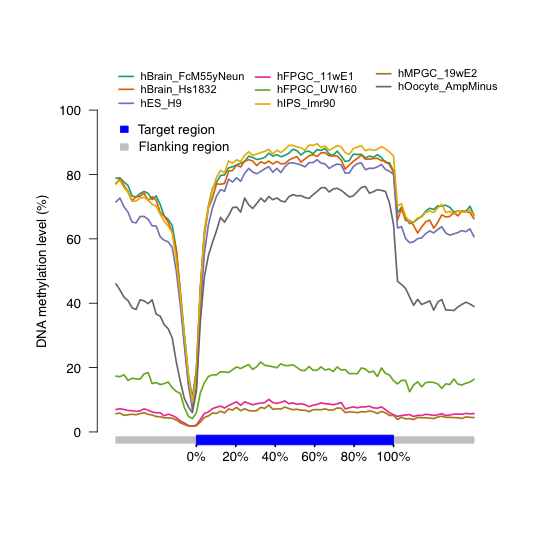
Figure 7.4: DNA methylation distribution across gene body
7.4 tanghulu
The Tanghulu plot is designed as show the methylation state on each cytosine by reads. (See what does “Tanghulu” strand for? Wikipedia)
- Command
cgmaptools tanghulu -h# DESCRIPTION
# Circle plot representing DNA methylation of each C [defualt CpG] site
# on each mapped reads.
#
# USAGE
# cgmaptools tanghulu [options] -r <ref> -b <bam> -l chr1:133-144
# or: cgmaptools tanghulu [options] -r <ref> -b <bam> -l chr1:133
# (aka mCTanghulu)
#
# Options:
# -r Samtools indexed reference genome seqeunce, fasta format. eg. hg19.fa
# - use samtools to index reference: samtools faidx <hg19.fa>
# -b Samtools indexed Bam file to view.
# - use samtools to index bam file: samtools index <input.bam>
# -l Region in which to display DNA methylation.
# - or specify a single position (eg. heterozygous SNP site), we will show allele specific methylation.
# -s Path to samtools eg. /home/user/bin/samtools
# - by defualt, we try to search samtools in your system PATH.
# -o Output results to file [default: CirclePlot.Ctype.region.Date.pdf].
# -t C context. [default: CG]
# - available context: C, CG, CH, CW, CC, CA, CT, CHG, CHH
# -d Ouput device. [default: pdf]
# - alternative: png
# -c Seperate reads by chain. [default: OFF]
# - specify this option to turn ON.
# -v Show vague allele linked reads. [ default: OFF]
# -g Genotype of heterozygous SNP site.
# - This option provides two alleles of htSNP site. eg. AT
# - The genotype information can be used to reduce vague alleles.
# - This option is specific to display methylation in allele specific mode.
# -D Minimum number of reads (depth) covered in this region or allele linked. [default: 0|OFF]
# -C Minimum number of C (specified type) covered in this region or allele linked. [default: 0|OFF]
# -W Width of graphics reigon in inches. [default: 4]
# -H Height of graphics reigon in inches. [default: 4]
# -R Resolution in ppi. [default: 300]
# - only available for png device.
# -h Help message.
#
# AUTHOR
# Contact: Zhu, Ping; pingzhu.work@gmail.com
# Last update: 2016-12-07Example
cgmaptools tanghulu -r genome.fa -b WG.bam -l chr1:2000-2400 -t CGOutput figure
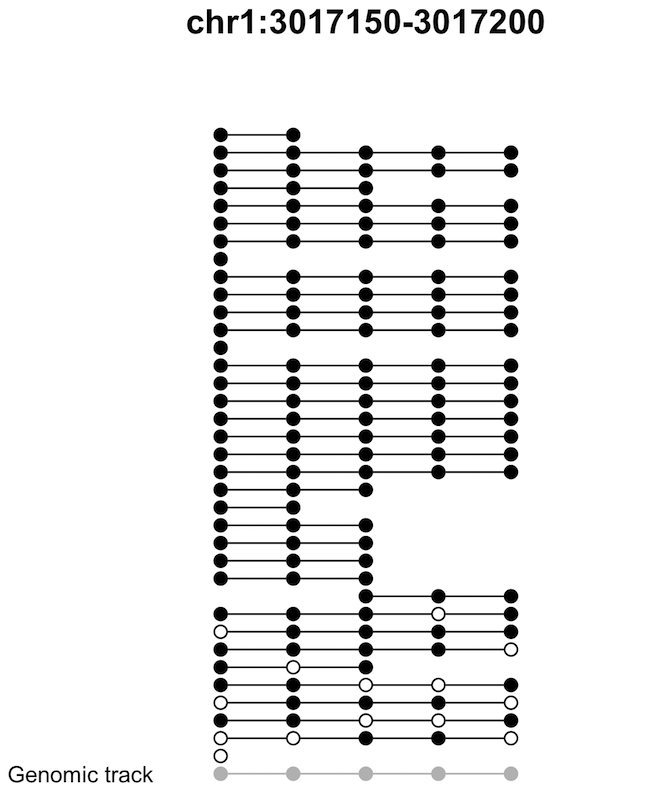
Figure 7.5: Tanghulu plot example
We also designed Tanghulu plot for visualizing reads that are support methylated, un-methylated, and vague reads for Allele-Specific Methylation (ASM) region.
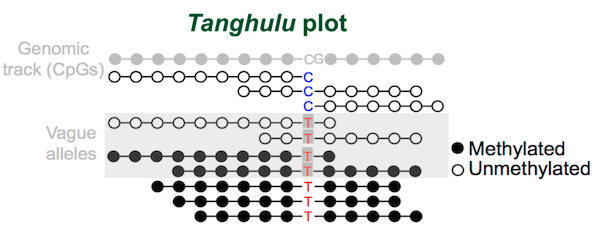
Figure 7.6: Tanghulu plot show vague-reads