6 Coverage Analysis
Read coverage is an important factor for interpreting DNA methylomes.
It requires different coverage levels for different purpose. For example, SNV calling requires higher coverage than it is required for DMR study. The SNV calling process is depending on all nucleotides (A, T, C and G), whereas DNA methylation levels only depend on T and C read counts aligned to cytosines.
In CGmapTools, we propsed two ways for evaluating the coverages of DNA methylations: OverAll Coverage (OAC) and Methylation-Effective Coverage (MEC).
- OAC is calculated as the average read coverage on all nucleotides on both strands, which are calculated from the ATCGmap file.
- MEC is calculated as the average read coverage only for cytosines, which is calculated from the CGmap file. Generally, the MEC is slightly higher than half of the OAC.
In CGmapTools, we provides function for basic statistics of coverages (cgmaptools oac stat and cgmaptools mec stat) and visualization of coverages in bins across genome (cgmaptools oac bin and cgmaptools mec stat).
6.1 oac
- Command
cgmaptools oac -h# Usage: cgmaptools oac <command> [options]
# Version: 0.1.2
# Updated on: Dec. 14th, 2018
# Commands:
# bin * overall coverage in bins
# stat * overall coverage statistics globally6.1.1 oac bin
- Command
cgmaptools oac bin -h# Usage: cgmaptools oac bin [-i <ATCGmap>] [-B 5000000]
# (aka ATCGmapCovInBins)
# Description: Generate the overall coverage in Bins.
# Contact: Guo, Weilong; guoweilong@126.com;
# Last Update: 2016-12-07
# Output Ex:
# chr1 1 5000 29.0000
# chr1 5001 10000 30.0396
# chr2 1 5000 35.0755
# chr2 5001 10000 40.0027
# chr3 1 5000 na
#
# Options:
# -h, --help show this help message and exit
# -i FILE File name end with .ATCGmap or .ATCGmap.gz. If not
# specified, STDIN will be used.
# -B BIN_SIZE Define the size of bins [Default: 5000000]
# -f FILE, --figure-type=FILE
# png, pdf, eps. Will not generate figure if not
# specified
# -H FLOAT Height of figure in inch [Default: 4]
# -W FLOAT Width of figure in inch [Default: 8]
# -p STRING Prefix for output figures
# -t STRING, --title=STRING
# title in the output figuresExample
cgmaptools oac bin -i WG.ATCGmap.gz -B 1000 -f png -p WG -t WG > WG.oac_bin.dataOutput figure
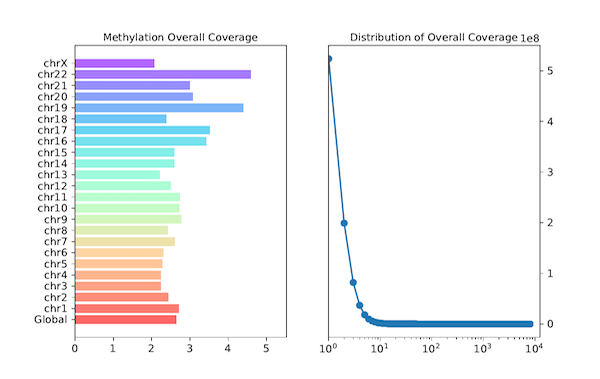
Figure 6.1: MEC example
6.1.2 oac stat
- Command
cgmaptools oac stat -h# Usage: cgmaptools oac stat [-i <ATCGmap>]
# (aka ATCGmapStatCov)
# Description: Get the distribution of overall coverages.
# Contact: Guo, Weilong; guoweilong@126.com;
# Last Update: 2018-05-02
# Output Ex:
# OverAllCov global 47.0395
# OverAllCov chr1 45.3157
# OverAllCov chr10 47.7380
# CovAndCount 1 1567
# CovAndCount 2 655
# CovAndCount 3 380
#
# Options:
# -h, --help show this help message and exit
# -i FILE File name end with .ATCGmap or .ATCGmap.gz. If not
# specified, STDIN will be used.
# -f FILE, --figure-type=FILE
# png, pdf, eps. Will not generate figure if not
# specified
# -H FLOAT Scale ratio for the Height of figure [Default: 4]
# -W FLOAT Width of figure in inch [Default: 8]
# -p STRING Prefix for output figuresExample
cgmaptools oac stat -i WG.ATCGmap.gz -p WG -f png > WG.oac_stat.dataoutput format:
The output format of
bin:chr1 1 5000 29.0000 chr1 5001 10000 30.0396 chr2 1 5000 35.0755 chr2 5001 10000 40.0027 chr3 1 5000 naThe output format of
stat:OverAllCov global 47.0395 OverAllCov chr1 45.3157 OverAllCov chr10 47.7380 CovAndCount 1 1567 CovAndCount 2 655 CovAndCount 3 380
6.2 mec
- Command
cgmaptools mec -h# Usage: cgmaptools mec <command> [options]
# Version: 0.1.2
# Updated on: Dec. 14th, 2018
# Commands:
# bin * methylation effective coverage in bins
# stat * methylation effective coverage statistics globally6.2.1 mec bin
- Command
cgmaptools mec bin -h# Usage: cgmaptools mec bin [-i <CGmap>] [-B 5000000]
# (aka CGmapCovInBins)
# Description: Generate the methylation-effective coverage in Bins.
# Contact: Guo, Weilong; guoweilong@126.com;
# Last Update: 2018-01-02
# Output Ex:
# chr1 1 5000 29.0000
# chr1 5001 10000 30.0396
# chr2 1 5000 35.0755
# chr2 5001 10000 40.0027
# chr3 1 5000 na
#
# Options:
# -h, --help show this help message and exit
# -i FILE File name end with .CGmap or .CGmap.gz. If not
# specified, STDIN will be used.
# -B BIN_SIZE Define the size of bins [Default: 5000000]
# -f FILE, --figure-type=FILE
# png, pdf, eps. Will not generate figure if not
# specified
# -H FLOAT Height of figure in inch [Default: 4]
# -W FLOAT Width of figure in inch [Default: 8]
# -p STRING Prefix for output figures
# -t STRING, --title=STRING
# title in the output figures
# -C CONTEXT, --context=CONTEXT
# specific context: CG, CH, CHG, CHH, CA, CC, CT, CW
# use all sites if not specifiedExample
cgmaptools mec bin -i WG.CGmap.gz -B 1000 -f png -p WG -t WG > WG.mec_bin.data
6.2.2 mec stat
- Command
cgmaptools mec stat -h# Usage: cgmaptools mec stat [-i <CGmap>]
# (aka CGmapStatCov)
# Description: Get the distribution of methylation-effective coverages.
# Contact: Guo, Weilong; guoweilong@126.com
# Last Update: 2018-05-02
# Output Ex:
# MethEffectCove global 47.0395
# MethEffectCove chr1 45.3157
# MethEffectCove chr10 47.7380
# CovAndCount 1 1567
# CovAndCount 2 655
# CovAndCount 3 380
#
# Options:
# -h, --help show this help message and exit
# -i FILE File name end with .CGmap or .CGmap.gz. If not
# specified, STDIN will be used.
# -f FILE, --figure-type=FILE
# png, pdf, eps. Will not generate figure if not
# specified
# -H FLOAT Scale factor for the Height of figure [Default: 4]
# -W FLOAT Width of figure in inch [Default: 11]
# -p STRING Prefix for output figures
# -C CONTEXT, --context=CONTEXT
# specific context: CG, CH, CHG, CHH, CA, CC, CT, CW
# use all sites if not specifiedExample
cgmaptools mec stat -i WG.CGmap.gz -p WG -f png > WG.mec_stat.dataOutput figure
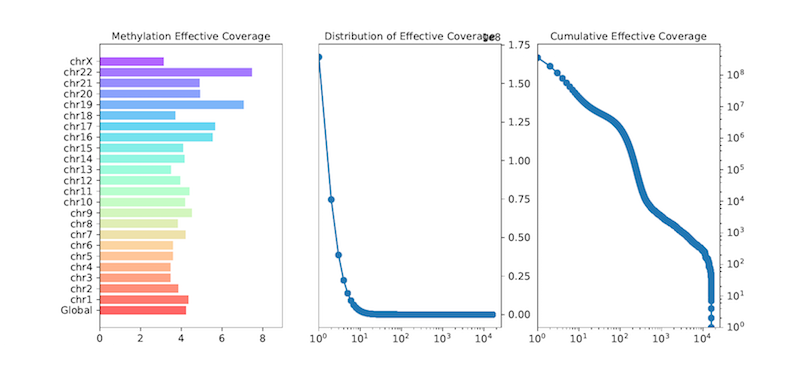
Figure 6.2: MEC example